Home
News and Reviews
Sort by date
All News and Reviews
News
Reviews and comments for product measurement reports
Mentions RAA in reviews
F.A.Q.
Structure of F.A.Q.
Theory and test signals
Distortions in software players in Andrpoid
Self-checking of headphones for marriage
Subjective test for the quality of the headphone wire
Reports of measured products
Recent reports
Manufacturers
Type of device
Wireless headphones
Headphones with active amplification
Wired headphones
USB
External AMP
External DAC
Internal Sound Card
External Sound Card
Smartphone
Player
Laptop/Tablet
Motherboard
Monitor
Headphone Amplifiers with Line In
ADC
Digital
Types of reports (test suite) PRO
Reports of headphones measurements
Reports of headphones AMPs' measurements - (internal amp: DAP, sound cards, DACs)
Reports of DACs' measurements - (Line out: DACs, sound cards and DAPs)
Comparison and selection
Comparison services
The frequency response of headphones
Impedance (Headphones, Headphone amplifiers)
Electric phase (Headphones)
Impulse, Envelope, Step responses and Square wave
QSD / Watterfall
Comparison of the frequency response/SPL of the bundles of headphones and amplifiers
Basic characteristics of headphones
Basic characteristics of headphone amplifiers
Voltage and Sensitivity
Comparison of volume gain AMPs
Comparison of the optimal range of volume control
SPL from bundle
Waveforms
Crosstalk
Crosstalk Phase
Harmonic Distortion vs Level
Spectra
Selection services
AMPs
Headphones
Selection of headphones for the target frequency response
On-Line calculators and converters
Amplifier Parameter Calculator
U1/U2 → dB
W1/W2 → dB
U1+dB → U2
U+R → W, I
W+R → U, I
I+R → U, W
dB/V ↔ dB/mW SPL
SPL Full
V(RMS) ↔ dBV ↔ dBu ↔ V(PP)
W ↔ mW ↔ dBW ↔ dBm
A ↔ mA ↔ dB(A) ↔ dB(mA)
Distortion: dB ↔ %
Volume level dB ↔ %
Converters
squig.link > QRange
squig.link > Hiby
Plugins
NOS R2R simulator
A subjective test for the quality of the headphone cable
On-Line Testing
Checking the quality of the headphone cable for Crosstalk of headphones
Defects in the sound of the CS43198 and CS43131 DACs
Check headphones for defects
Listen to the degradation of the sound quality from the system mixer
Individual calibration of headphones
Индивидуальная калибровка наушников
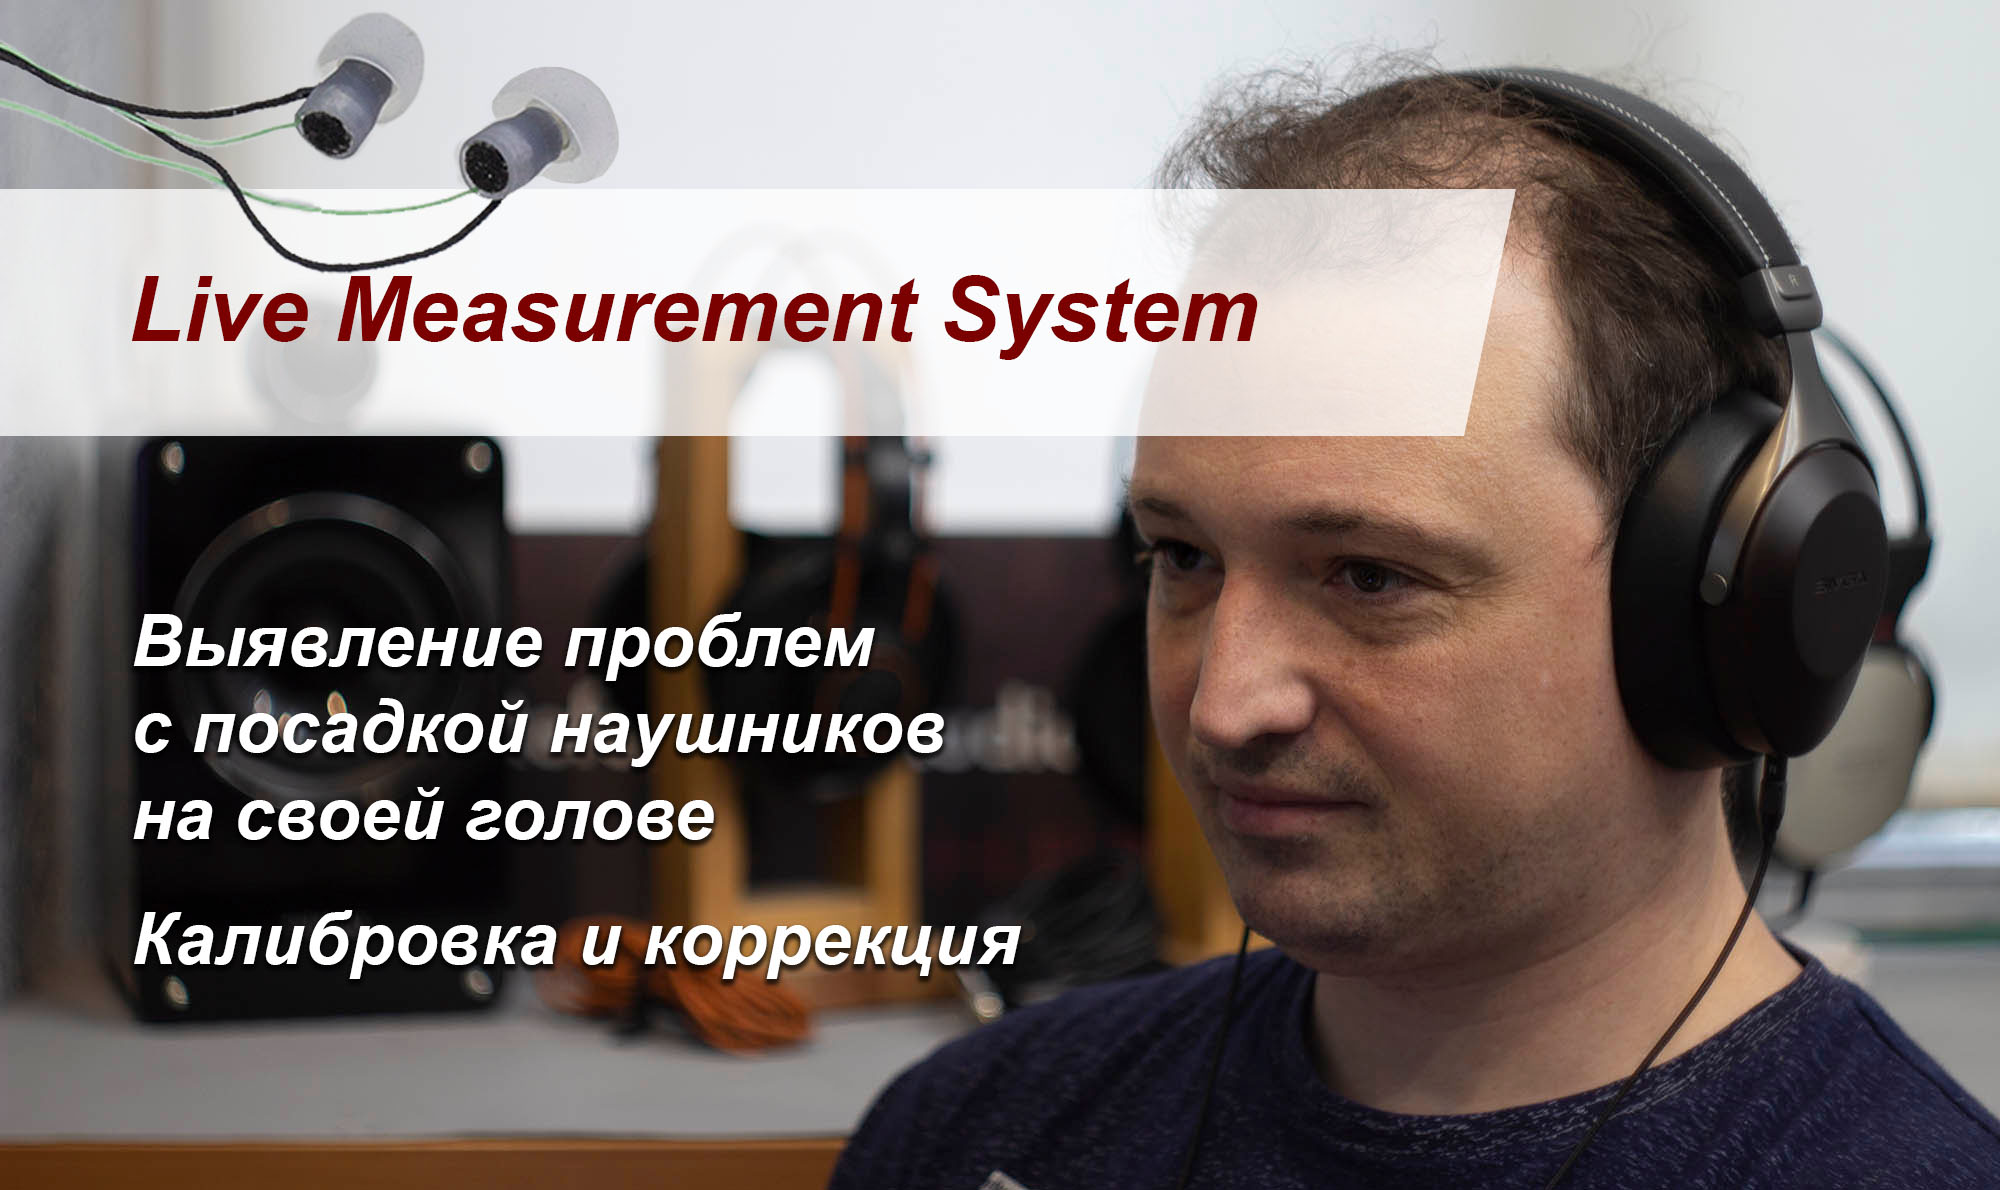
Как проводится измерение наушников для индивидуальной калибровки
В каком виде доступен результат измерения
Инструкция - как настраивать наушники с помощью инструментов сайта RAA
Где будет работать калибровка (устройства, плагины, браузеры)
Инструкция - настройка выгрузки пресета для APO Equalizer
Инструкция - настройка экспорта в параметрический эквалайзер (PEQ)
Инструкция к конвертеру для параметрического эквалайзера QRange
Инструкция к конвертеру для параметрического эквалайзера Hiby
About RAA
About RAA
How to submit a product for testing
Hardware and software RAA complex
History
The main approach to the definition of quality
Collaboration
Certification
Integration
Site settings
Select an adapted version of the site for your screen
Account settings
Site settings
Russian version of the site
Log in/Register
My devices
Create a favorite device group
Add devices in the favorite groupHistory
Groups of devices
Autoload of groups
Create custom device
Close menu
Frequency response
Your browser does not support Canvas
Device display options
Cayin N5 MK2
Menu
Style:
Line
Dotted line
Points line
Points line 2
-
Line3
Type test:
normal
hd
multy50
Delete
Saving and switching to other services
Go to other services with the selected headphones from this service
Cayin N5 MK2
Compare sensitivities and impedances of headphones
Waveforms
Impulse, Envelope, Step responses and Square wave
QSD / Watterfall
Spectra
Harmonic Distortion vs Level
Crosstalk
Crosstalk Phase
Available only to registered users with Pro account
Save selected devices to the favorite group
:
New Group
List and setting of Groups
Save to the new favorite group:
Save the graphics to your favorites
Available only to registered users with Pro account
Devices add to graph
Devices add to graph
Headphones
Headphone amplifiers
DAC
About the types of tests
Add favorite devices
For a regular account, only
the default set group
is available.
Only
PRO account
users can create and upload their sets.
AMP Curve Impedance
AMP Flat Impedance
Bundle AMP Home
Bundle AMP Portative
Bundle HP Home
Bundle HP Portative
Bundle HP+AMP
Bundle HP+AMP Param
Default
for Power AMP Home
for Power AMP Portative
for Power HP Home
for Power HP Portative
FR HP
HP balanced armature type
HP dynamic type
HP flat impedance
HP Home
HP IMP
HP Portative
HP+AMP Power
IMP HP Home
IMP HP Portative
SPL Home AMP
SPL Portative AMP
Title Full-Size/Home AMP
Title In-Ear/Portable AMP
List and setting of Groups
Add a marker/Frequency response editing
Type
Marker / Details
Range / Details / Start - End
Range / Correction
ISO 226-2009 / Correction
AMP / Correction
Smoothing / Correction
Cut / Correction
711:SIEC / Correction
Harman Target Bass / Correction
Device
Off
All
[0] Cayin N5 MK2
Name
Number
О маркерах и инструментах редактирования
Marker Details
Range Details
Range / Correction
Smoothing / Correction
Cut / Correction
ISO 226-2009 / Correction
AMP / Correction
711:SIEC / Correction
Harman Target Bass / Correction
Graphics setting view
General Graph Display Options
Comparison by:
Sensitivity
Frequency response
Average over the frequency range
Derivative frequency response
Export Frequency response:
Off
Visible
Graph Display Type:
Line
Area
Multy Calculations:
Off
Multy Calculations
Calculations:
Off
The difference +
The difference -
View
Default
2 Colum
Parameters of the axis of the graph
Comparison of the frequency for frequency response:
Hz
Frequency band:
-
Hz
Sound pressure range:
-
dB SPL
Range of Magnitude:
-
dB
Step of scale:
dB
Тип сетки:
обычная сетка
без сетки
user сетка
только насечки
Other parameter
Visible:
Summary (Right + Left)
Left and Right
Left
Right
Difference (right and left)
Show title of devices:
Visible
Close
In the header:
Name of the test
Device name
Full device name
Device name Name of the test
On the chart:
Full device name
Device name
Feature/Mode
Full device name , Details
Device name, Details
Feature/Mode, Details
Details
Channel:
Visible
Close
In the header
Stand:
Visible
Close
In the header
Location of names:
Top
Bottom
Alternative device names:
Close
Visible
Sorting:
▲
▼
Export Frequency response
Frequency Response Export Settings
Export:
FR to the target
Compensation FR
Type of target curve:
Smoothed on the HF
Original
Export Format:
APO
CSV . (squig.link)
CSV ,;
CSV .,
Style:
Line
Dotted line
Points line
Points line 2
-
Line3
Compensation level:
%
Lower frequency limit:
Hz
Low frequency compensation level:
%
Midrange compensation level:
%
High frequency compensation level:
%
Frequency band
From:
Hz
to
Hz
To export the frequency response or compensation curve to an external equalizer, activate the
Export Frequency response
mode in the
General Graph Display Options
The field with the upload for export is available only for users of the
Pro account
.
Скопировать
Скачать
-
.csv
Скачать flat_target.csv
squig.link
Инструкции к настройкам экспорта АЧХ и эквализации
Инструкция - настройка выгрузки пресета для APO Equalizer
Инструкция - настройка экспорта в параметрический эквалайзер (PEQ)
Инструкция к конвертеру для параметрического эквалайзера QRange
Конвертер для Qrange
Инструкция к конвертеру для параметрического эквалайзера (PEQ) Hiby
Конвертер для Hiby
Частотная характеристика зависит от используемых стендов для измерений. Так как все стенды являются упрощенными или усредненными моделями людей, то результаты приблизительные. Максимально точный график можно получить лишь при индивидуальном измерении наушников на собственной голове с помощью
RAA Live Measurement System
.
Для коррекции АЧХ в первую очередь желательно использовать графики живых измерений от стендов
Human
, если такие есть в отчете. Особенно актуально это для
низкочастотного диапазона
.
it is a translation from the Russian language. Original text in
Russian page
.
You can help us with the correct translation into English.
facebook
and
feedback
Thank You!
TT
 TT