Fostex T50RP MK3

After testing in the benchmark mode in the Reference Audio Analyzer software, the data is added to the online database of the RAA website.
You can view the test results on the comparison pages and summary reports for beginners
 and professionals. You can go to the desired report or comparison/selection service through the menu on this page. Additionally, you can go to the comparison pages from any graph in this report and add other tested products for direct comparison.
This is a main summary professional characteristics report for Fostex T50RP MK3.
You can also view other summary reports for Fostex T50RP MK3
You can view the test results on the comparison pages
and summary reports for beginners and professionals. You can go to the desired report or comparison/selection service through the menu on this page. Additionally, you can go to the comparison pages from any graph in this report and add other tested products for direct comparison.This is a main summary professional characteristics report for Fostex T50RP MK3.
You can also view other summary reports for Fostex T50RP MK3
- Main professional characteristics report
- Compatibility with amplifier sources - graphs
- Recommendations for equalization and comparison with target curves
- List of similar models by frequency response
- Simple report for "dummies" with explanations of the main characteristics
- Compatibility with amplifier sources and external conditions for "dummies"

| Sensitivity average in band from 100 Hz - 10 kHz | 102.0 | dB/V SPL |
| 89.3 | dB/mW SPL | |
| Impedance average in band from 40 Hz - 15 kHz | 53.6 | ohm |
| For 90 dB SPL, a voltage is required | -12.0 | dBV |
| 0.251 | VRMS | |
| Taking into account the peak factor of 9 dB for the music signal | -3.0 | dBV |
| 0.709 | VRMS | |
| Measurements were performed on the stand: | HDM-X | |
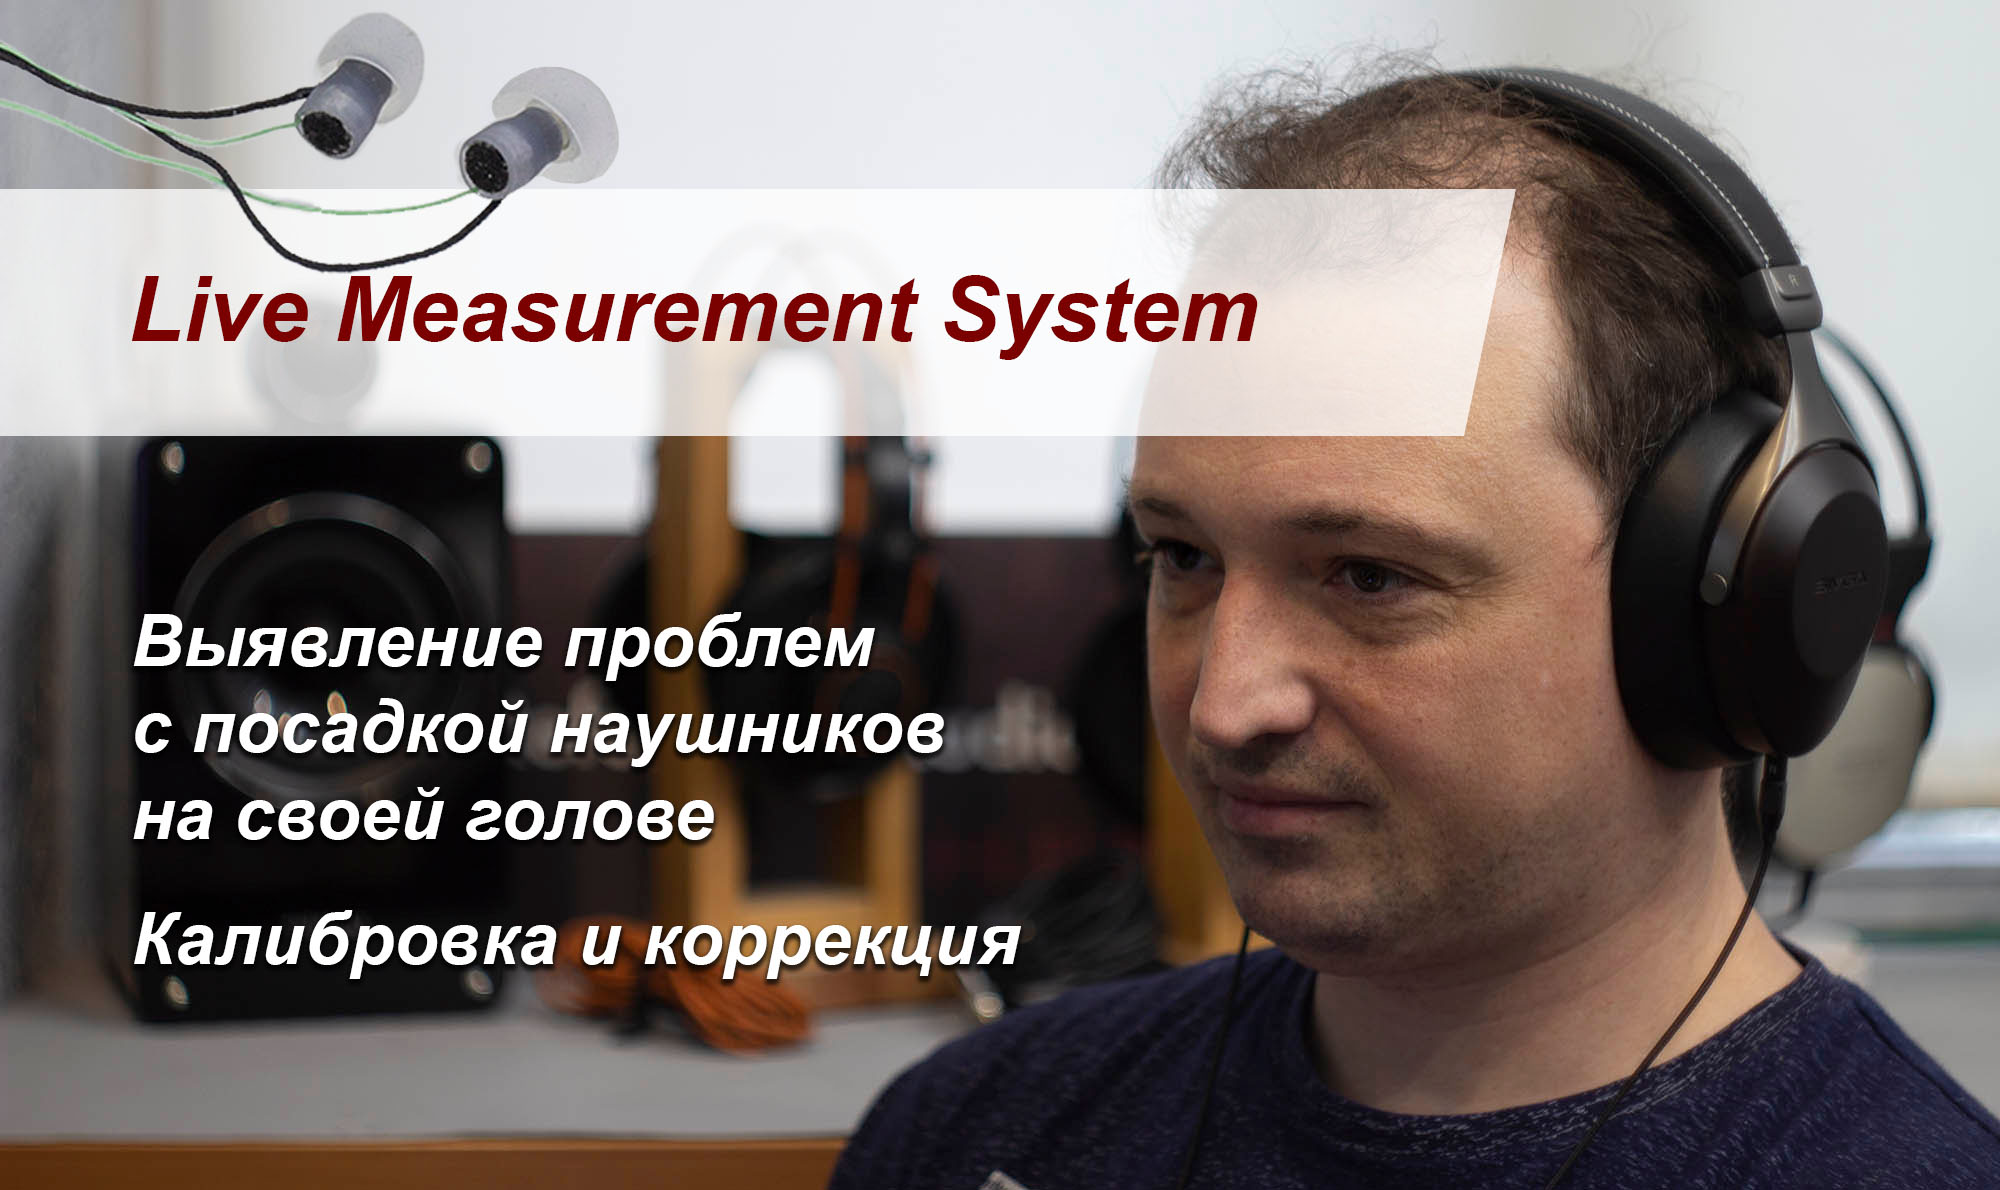
С 2024 года измерения полноразмерных наушников в RAA проводятся не только на инструментальных стендах, но и вживую с помощью разработанной системы в RAA - Live Measurement System. Это позволяет увидеть реальное поведение наушников и их вариативность звучания относительно стандартных стендов. Результаты таких измерений в отчетах обозначаются как со стендов Human. В этом отчете - это:
Т.к. АЧХ зависит от посадки наушников и их прогрева/износа, то в RAA была разработан универсальный комплект Live Measurement System
для контроля своих наушников на собственной голове. Типовые комплекты доступны для приобретения.
Frequency response Fostex T50RP MK3 headphone
Brief information
Clicking on the graph will take you to the comparison page of different models with advanced graph display settings.
Impedance / Electric phase Fostex T50RP MK3 headphone
Brief information
Clicking on the graph will take you to the comparison page of different models with advanced graph display settings.
Frequency response and sensitivity Fostex T50RP MK3 headphone
Graphics setting view
Type of chart SPL
| SPL | Voltage | Current | Power | |||
| dB SPL | dBV | VRMS | dB(mA) | mA | dBm | mW |
| 60 | -42.0 | 0.008 | -16.6 | 0.15 | -29.3 | 0.001 |
| 70 | -32.0 | 0.025 | -6.6 | 0.47 | -19.3 | 0.012 |
| 80 | -22.0 | 0.080 | 3.4 | 1.5 | -9.3 | 0.12 |
| 90 | -12.0 | 0.25 | 13.4 | 4.7 | 0.71 | 1.2 |
| 100 | -2.0 | 0.80 | 23.4 | 14.8 | 10.7 | 11.8 |
| 110 | 8.0 | 2.5 | 33.4 | 46.9 | 20.7 | 118 |
| 120 | 18.0 | 8.0 | 43.4 | 148 | 30.7 | 1179 |
| 130 | 28.0 | 25.1 | 53.4 | 469 | 40.7 | 11788 |
Brief information
Clicking on the graph will take you to the comparison page of different models with advanced graph display settings.
Impulse response Fostex T50RP MK3 headphone
Brief information
Clicking on the graph will take you to the comparison page of different models with advanced graph display settings.
Динамический спектр Fostex T50RP MK3 headphone
Brief information
Clicking on the graph will take you to the comparison page of different models with advanced graph display settings.
Other summary reports for Fostex T50RP MK3 headphone

More detailed
Measurements of Fostex T50RP MK3 were carried out by Roman Kuznetsov on the hardware-software complex RAA.
The Fostex T50RP MK3 test was conducted as a black box test, without regard to cost and prestige. This is the basic principle for making measurements, measurement reports and developing tests in RAA.
I believe that it is important to do not make an absolute assessment of the device, but an aggregate assessment when working together with a source amplifier and taking into account external factors. This allows you to effectively reveal the potential of the entire set of devices or to make a more optimal choice of components.

Kuznetsov Roman
Founder of RAA
Information for Authors. You can freely use the graphics in your articles with a link to us.