Measurement's report FLC 8N Green Gray Gray test and graphs - Reference Audio Analyzer

Test report - general data of FLC 8N Green Gray Gray headphone

Frequency response, Impedance, Frequency response with standard AMPs


Graphics setting view
Frequency band, Hz:
Range, dB:

Perception of headphone frequency response curves of equal loudness ISO 226-2009


General results
General results FLC 8N Green Gray Gray
Channel
Summary (Right + Left)
Sensitivity average in band from 100 Hz to 10 kHz, dB/V
131,5
Impedance average in band from 40 Hz to 15 kHz, ohm
11,9
For 94,0 dB SPL need, VRMS
0,013
For 94,0 dB SPL need, mW
0,015

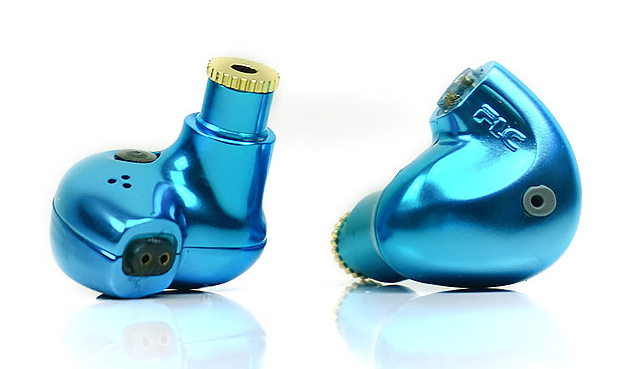
The table shows a most important technical characteristics of FLC 8N Green Gray Gray

*Center channel headphone is received by averaging between left and right channels


Test conditions
  • Type of headphones: In-Ear or Tablet
  • Measurements were performed on the stand:
    • Solid simulator-bushing SIEC (emulation of auditory channel)


Sensitivity of FLC 8N Green Gray Gray headphone


Graphics setting view
Frequency band, Hz:
Channel:


Table of measured characteristics
Sensitivity FLC 8N Green Gray Gray
Channel
Left
Right
Sensitivity average in band from 100 Hz to 10 kHz, dB/V
131,8
131,3
Sensitivity at 500 Hz at 1 V, dB
130,8
131,0
Sensitivity at 500 Hz at 1 mW, dB
111,3
111,5
Sensitivity at 1000 Hz at 1 V, dB
132,5
132,1
Sensitivity at 1000 Hz at 1 mW, dB
113,4
113,0

The sensitivity was calculated by data from the measuring stand SIEC


Frequency response of FLC 8N Green Gray Gray headphone


Graphics setting view
Frequency band, Hz:
Range, dB:
Channel:


Table of measured characteristics
Frequency response FLC 8N Green Gray Gray
Channel
Left
Right
Variation in frequency response in band from 100 Hz to 10 kHz, dB
-3,01, 5,68
-4,15, 4,33


The RMS variation between the right and left channels
FLC 8N Green Gray Gray from stand SIEC
Deviation between channels in band 40 Hz to 15 kHz, dB
0,5
Deviation between channels in low-frequency range 40 Hz to 200Гц, дБ
0,3
Deviation between channels in mid-frequency range 200 Hz to 2 kHz, dB
0,4
Deviation between channels in hi-frequency range 2 kHz 15 kHz, dB
0,7

Impedance of FLC 8N Green Gray Gray headphone


Graphics setting view
Frequency band, Hz:
Channel:


Table of measured characteristics
Impedance FLC 8N Green Gray Gray
Channel
Left
Right
Impedance average in band from 40 Hz to 15 kHz, ohm
11,8
12,0
Resistance at 500 Hz, ohm
11,2
11,4
Resistance at 1000 Hz, ohm
12,2
12,4
The minimum value in band from 40 Hz to 15 kHz at frequency, Hz
9094,4
9576,7
The minimum value in band from 40 Hz to 15 kHz, ohm
10,0
10,3
The maximum value in band from 40 Hz to 15 kHz at frequency, Hz
2215,2
3650,3
The maximum value in band from 40 Hz to 15 kHz, ohm
14,4
14,8

Electric phase of FLC 8N Green Gray Gray headphone


Graphics setting view
Frequency band, Hz:
Range, degree:
Channel:


Table of measured characteristics
Electric phase FLC 8N Green Gray Gray
Channel
Left
Right
Average variation in phase response in band from 20 Hz to 20 kHz, degree
4,5
4,4
The minimum value in band from 20 Hz to 20 kHz at frequency, Hz
6670,1
7655,5
The minimum value in band from 20 Hz to 20 kHz, degree
-4,8
-4,8
The maximum value in band from 20 Hz to 20 kHz at frequency, Hz
19741,4
19741,4
The maximum value in band from 20 Hz to 20 kHz, degree
21,8
21,6

Frequency response of FLC 8N Green Gray Gray headphone when connected to amplifiers with constant output impedance


Graphics setting view
Frequency band, Hz:
Range, dB:
Channel:


Table of measured characteristics
Frequency response of headphone FLC 8N Green Gray Gray with amplifier with a constant impedance
Channel
Left
Right
Variation in FR from AMP 0 ohm in band 100 Hz to 10 kHz, dB
-3,01, +5,68
-4,15, +4,33
Variation in FR from AMP 10 ohm in band 100 Hz to 10 kHz, dB
-2,45, +5,52
-3,58, +4,37
Variation in FR from AMP 20 ohm in band 100 Hz to 10 kHz, dB
-2,24, +5,46
-3,36, +4,43
Variation in FR from AMP 50 ohm in band 100 Hz to 10 kHz, dB
-2,02, +5,40
-3,40, +4,49
Variation in FR from AMP 100 ohm in band 100 Hz to 10 kHz, dB
-1,91, +5,37
-3,52, +4,51
Variation in FR from AMP 300 ohm in band 100 Hz to 10 kHz, dB
-1,82, +5,37
-3,62, +4,53

Deviation of frequency response of FLC 8N Green Gray Gray headphone when connected to amplifiers with constant output impedance


Graphics setting view
Frequency band, Hz:
Range, dB:
Channel:


Table of measured characteristics
Variation in frequency response with amplifiers with constant output resistance from FLC 8N Green Gray Gray
Channel
Summary (Right + Left)
With amplifier impedance at 10 ohm in band 20 Hz to 20 kHz, dB
1,4
With amplifier impedance at 20 ohm in band 20 Hz to 20 kHz, dB
1,9
With amplifier impedance at 50 ohm in band 20 Hz to 20 kHz, dB
2,5
With amplifier impedance at 100 ohm in band 20 Hz to 20 kHz, dB
2,8
With amplifier impedance at 300 ohm in band 20 Hz to 20 kHz, dB
3,0

*Center channel is received by data averaging between the left and right channels


Frequency response of FLC 8N Green Gray Gray headphone when connected to an amplifier with zero output impedance and raising of output impedanse in low frequencies


Graphics setting view
Frequency band, Hz:
Range, dB:
Channel:


Table of measured characteristics
Frequency response with an amplifier with zero output resistance and raising of output resistance in low frequencies from FLC 8N Green Gray Gray
Channel
Left
Right
Variation in frequency response in band from 100 Hz to 10 kHz, dB
-2,76, 5,93
-3,90, 4,58

Deviation of frequency response of FLC 8N Green Gray Gray headphone when connected to an amplifier with zero output impedance and raising of output impedanse in low frequencies


Graphics setting view
Frequency band, Hz:
Range, dB:
Channel:


Table of measured characteristics
Variance of frequency response FLC 8N Green Gray Gray depending on the total output resistance of the amplifier with zero resistance and a rise of resistance at low frequencies
Variance frequency response at the frequency 20 Hz, dB
-10,6
Variance frequency response at the frequency 40 Hz, dB
-5,2
Variance frequency response at the frequency 80 Hz, dB
-2,2

Perception of headphone frequency response curves of equal loudness ISO 226-2009 of FLC 8N Green Gray Gray headphone


Graphics setting view
Channel:


Table of measured characteristics
Perception of headphone frequency response curves of equal loudness ISO 226-2009 from FLC 8N Green Gray Gray
Channel
Summary (Right + Left)
From level 48 dB at 72 dB SPL in band 100 Hz to 10 kHz, dB
-8,0, +13,8
From level 36 dB at 72 dB SPL in band 100 Hz to 10 kHz, dB
-6,9, +10,7
From level 24 dB at 72 dB SPL in band 100 Hz to 10 kHz, dB
-5,8, +7,6
From level 12 dB at 72 dB SPL in band 100 Hz to 10 kHz, dB
-4,7, +4,6
From level 0 dB at 72 dB SPL in band 100 Hz to 10 kHz, dB
-3,6, +5,0
From level -12 dB at 72 dB SPL in band 100 Hz to 10 kHz, dB
-2,5, +5,7
From level -24 dB at 72 dB SPL in band 100 Hz to 10 kHz, dB
-4,3, +6,4
From level -36 dB at 72 dB SPL in band 100 Hz to 10 kHz, dB
-7,1, +7,0

*Center channel is received by data averaging between the left and right channels


Impulse response of FLC 8N Green Gray Gray headphone


Graphics setting view
Time, ms:
Channel:


Impulse Response Envelope (ETC - Energy Time Curve) of FLC 8N Green Gray Gray headphone


Graphics setting view
Time, ms:
Range, dB:
Channel:


Step response of FLC 8N Green Gray Gray headphone


Graphics setting view
Time, ms:
Channel:


QSD / Watterfall of FLC 8N Green Gray Gray headphone


Graphics setting view
Frequency band, Hz:
Channel:


Delta QSD / Delta Watterfall of FLC 8N Green Gray Gray headphone


Graphics setting view
Frequency band, Hz:
Channel:


On-line comparison and selection services for FLC 8N Green Gray Gray

Comparison the frequency response

Impedance

Electric phase

Compare the frequency response of the bundles

Comparison of basic characteristics: Sensitivity, Impedance

Determination of the required voltage level from a headphone amplifier for 8N and comparison with other models A additional analytics of compatibility with specific amplifiers

Comparing changes in frequency and sound pressure as a function of the applied voltage and a impedance of an amplifier

Headphone square wave comparison at the required frequency

The automatic selection of the optimal AMP models from 8N


More detailed

Measurements of FLC 8N Green Gray Gray were carried out by Roman Kuznetsov on the hardware-software complex RAA.

The FLC 8N Green Gray Gray test was conducted as a black box test, without regard to cost and prestige. This is the basic principle for making measurements, measurement reports and developing tests in RAA.

I believe that it is important to do not make an absolute assessment of the device, but an aggregate assessment when working together with a source amplifier and taking into account external factors. This allows you to effectively reveal the potential of the entire set of devices or to make a more optimal choice of components.


Kuznetsov Roman
Founder of RAA


Known by the nickname romanrex
Аuthor of articles iXBT.com


Information for Authors. You can freely use the graphics in your articles with a link to us.


FLC 8N is available in reports and services. You are in a professional report.

Information for all

Versus of characteristics


Original text in Russian page. Translation page is not yet ready

You can help with translation via the: facebook and feedback.


Comments

No comments to FLC 8N
Commentary view:


Want to leave a comment or ask a question? Register now or log in