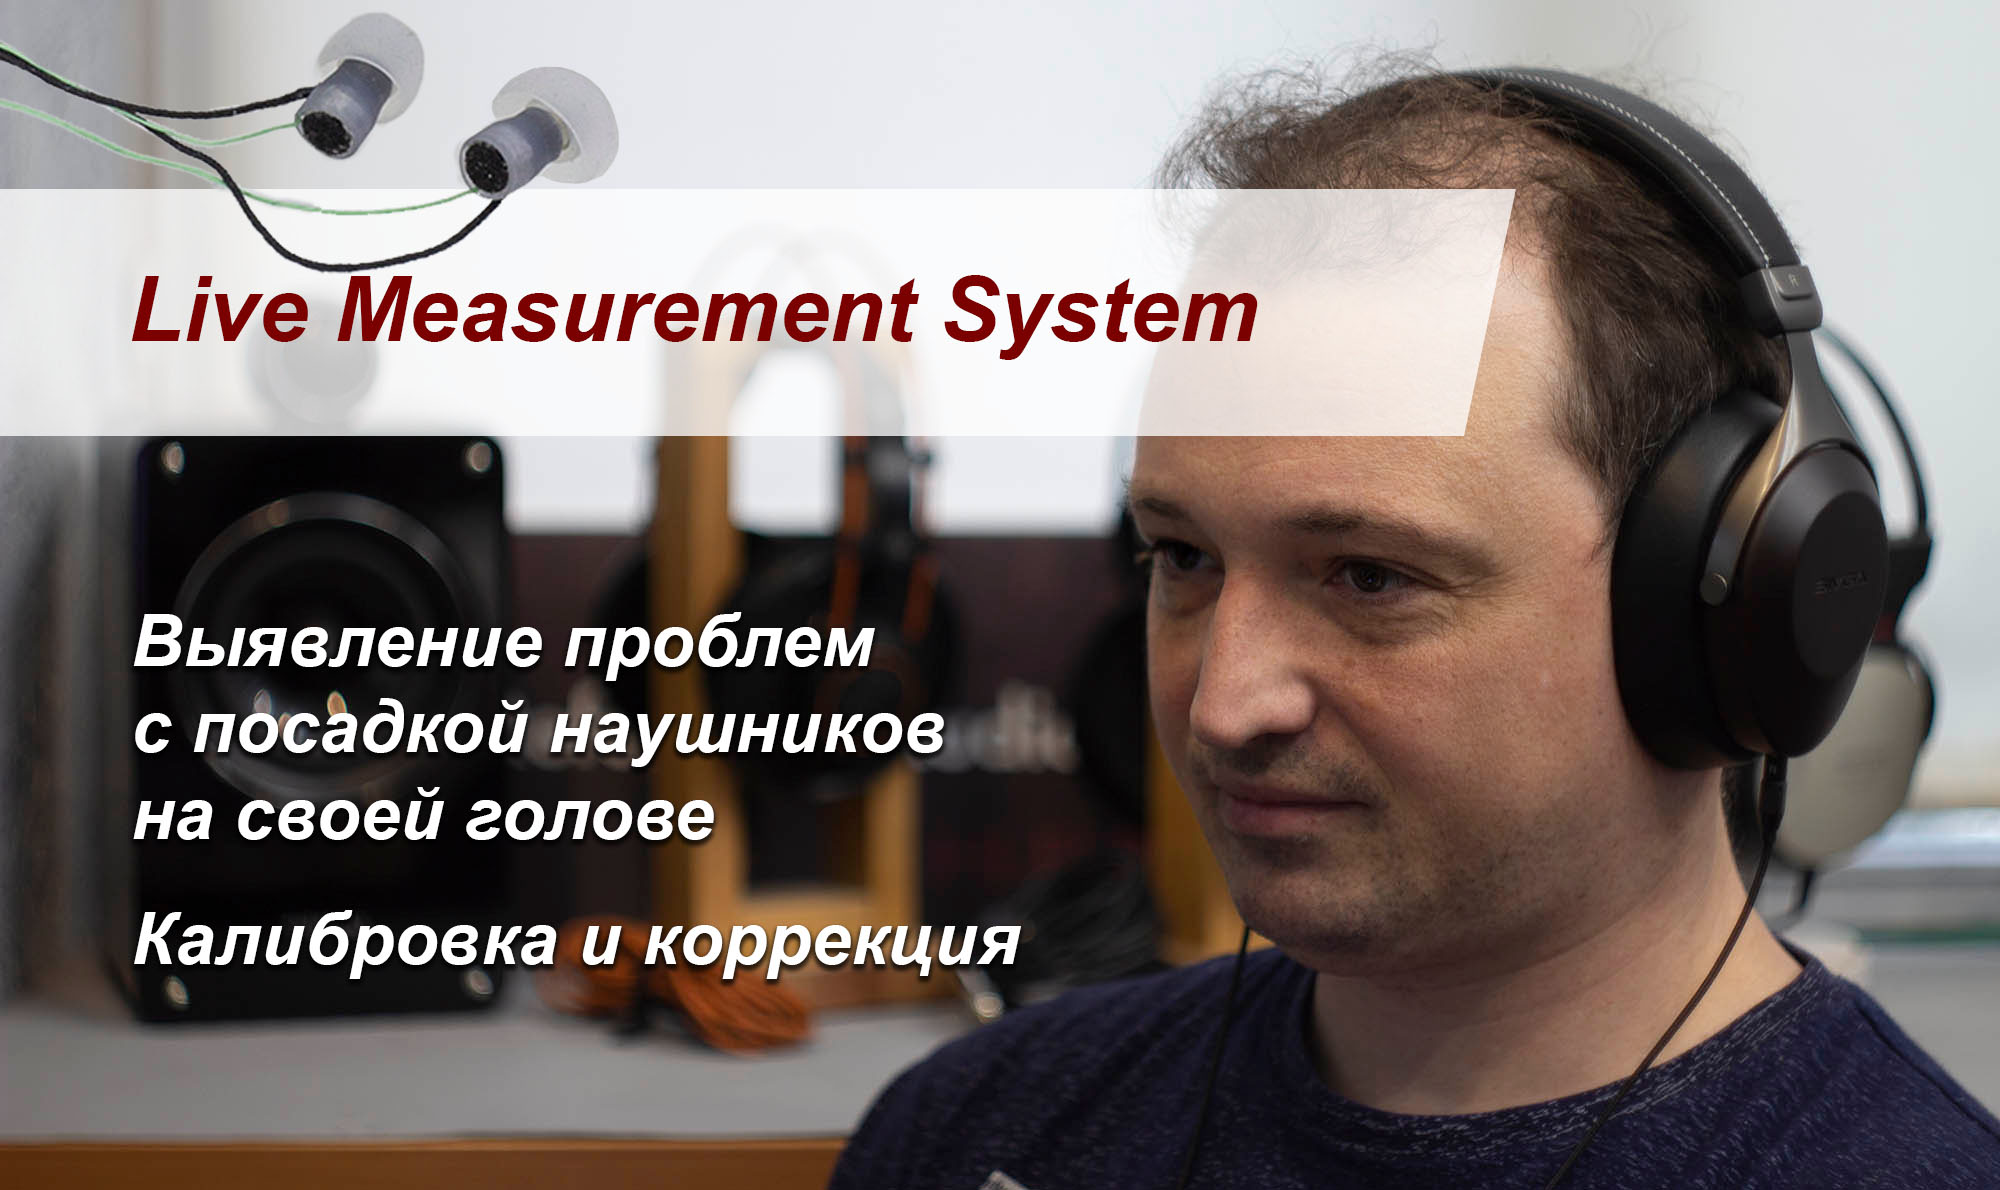
Reference Audio Analyzer
software and hardware complex for measurements, analytics and generation of reports by audio devices


The table shows a most important technical characteristics of Audiotrak Prodigy 7.1 HP On
Calculate sound pressure level in headphones with online calculator with data entered from the table for Audiotrak Prodigy 7.1 HP OnReport earlier version
Version report: V1~V2
This model was tested for a long time and the report does not have the following graphs:
Version report: V1Version report: V2
- Frequency response
- Impedance
- Frequency response with loaded resistors
- Variation in frequency response dependence of load dynamic type headphones
- Frequency response vs load balance armature headphone type (one driver)
- Variation in frequency response vs load balance armature headphone type (one driver)
- Impedance
- Impedance
Version report: V3
- Maximum voltage output level vs load
- Maximum current level output vs load
- Maximum power level output level vs load
Version report: V4
- THD vs load vs output voltage
- Harmonic distortion spectrum vs amplitude vs loaded
- Crosstalk
- Crosstalk Phase
- Spectrum of IMD SMPTE vs Level
- Spectrum of IMD CCIF vs Level
- Spectrum of Multitone Distortion vs Level vs Load
 Frequency response headphone amplifier Audiotrak Prodigy 7.1 HP On
  Impedance headphone amplifier Audiotrak Prodigy 7.1 HP On
  Frequency response with loaded resistors from Audiotrak Prodigy 7.1 HP On
  Frequency response headphone amplifier Audiotrak Prodigy 7.1 HP On loaded dynamic headphone type
  Deviation of frequency response headphone amplifier Audiotrak Prodigy 7.1 HP On loaded dynamic headphone type
  Frequency response headphone amplifier Audiotrak Prodigy 7.1 HP On loaded type balance armature headphone type
  Audiotrak_Prodigy 7.1 HP On test report and technical review") Deviation of frequency response headphone amplifier Audiotrak Prodigy 7.1 HP On loaded type balance armature headphone type
Deviation of frequency response headphone amplifier Audiotrak Prodigy 7.1 HP On loaded type balance armature headphone type  Audiotrak_Prodigy 7.1 HP On test report and technical review") Maximum voltage output level vs load Audiotrak Prodigy 7.1 HP On
Maximum voltage output level vs load Audiotrak Prodigy 7.1 HP On 
The device was tested for a long time, a method of constructing the graph and table were outdated and not suitable for direct comparison of values between different devices. The current data are the closest to "Before hard overload" as the maximum level before clipping. The latest version of the methodology uses to build on the characters of the spectra and divided into "Pure power @ class A", "Optimal power @ class AB", "Hard power @ B class" and "Before hard overload".
Now the original data to update the graph and table no. Require re-testing of the device. Re-test will be conducted only in the presence of the device in a test lab RAA.
Reports and testing methodology is gradually updated. We try to generate the report in such a way that it would have been a single kind of report for all devices, convenient for direct comparison.
We constantly introduce new tests and improving the options for displaying graphs and parameters. It introduces different changes in reports. Because reports are generated automatically, the updates do not take much time.
In the development and implementation of new tests, new reports are more complete. To update some charts and tables may require additional time to process the raw data separately for each device.
Some devices require re-testing.
Maximum current level output vs load Audiotrak Prodigy 7.1 HP On 
The device was tested for a long time, a method of constructing the graph and table were outdated and not suitable for direct comparison of values between different devices. The current data are the closest to "Before hard overload" as the maximum level before clipping. The latest version of the methodology uses to build on the characters of the spectra and divided into "Pure power @ class A", "Optimal power @ class AB", "Hard power @ B class" and "Before hard overload".
Now the original data to update the graph and table no. Require re-testing of the device. Re-test will be conducted only in the presence of the device in a test lab RAA.
Reports and testing methodology is gradually updated. We try to generate the report in such a way that it would have been a single kind of report for all devices, convenient for direct comparison.
We constantly introduce new tests and improving the options for displaying graphs and parameters. It introduces different changes in reports. Because reports are generated automatically, the updates do not take much time.
In the development and implementation of new tests, new reports are more complete. To update some charts and tables may require additional time to process the raw data separately for each device.
Some devices require re-testing.
Maximum power level output level vs load Audiotrak Prodigy 7.1 HP On 
The device was tested for a long time, a method of constructing the graph and table were outdated and not suitable for direct comparison of values between different devices. The current data are the closest to "Before hard overload" as the maximum level before clipping. The latest version of the methodology uses to build on the characters of the spectra and divided into "Pure power @ class A", "Optimal power @ class AB", "Hard power @ B class" and "Before hard overload".
Now the original data to update the graph and table no. Require re-testing of the device. Re-test will be conducted only in the presence of the device in a test lab RAA.
Reports and testing methodology is gradually updated. We try to generate the report in such a way that it would have been a single kind of report for all devices, convenient for direct comparison.
We constantly introduce new tests and improving the options for displaying graphs and parameters. It introduces different changes in reports. Because reports are generated automatically, the updates do not take much time.
In the development and implementation of new tests, new reports are more complete. To update some charts and tables may require additional time to process the raw data separately for each device.
Some devices require re-testing.
THD vs load vs output voltage Audiotrak Prodigy 7.1 HP On